


A crypto crash could be imminent as Bitcoin forms a risky pattern, gold prices jump to a record high, and Apollo Management warns of market turmoil.
Summary
- Bitcoin price has formed a rising wedge pattern on the weekly chart.
- Apollo Global, a $908 billion company, expects turbulence in the market.
- Gold and the Swiss franc have soared to a record high.
One of the potential signs of turmoil in the financial market is the ongoing gold price surge. Gold jumped to a record high of $4,438, much higher than the year-to-date low of $2,500. This surge helped to propel silver to an all-time high of $68.50.
Gold, a precious metal that has been used for centuries, is often seen as a safe-haven asset. Historically, investors and central banks pile in the metal when they expect substantial risks in the market.
Meanwhile, Apollo Global Management, one of the biggest players in the private equity and credit industries, is bracing for market turmoil in 2026.
According to the Financial Times, the company, which has $908 billion in assets, is moving to cash, cutting leverage, and selling assets in riskier corners of the market as it anticipates turbulence.
‘Something bad happens’
The FT quoted Marc Rowan, the company’s chief executive, who told his investors that he was amassing cash to position the company well when “something bad happens.” He added:
“We believe that prices are high, that rates — long rates — are not likely to plummet, and that we have enhanced geopolitical risk. As a firm, we are in risk reduction mode. We preach risk reduction. Our balance sheet is in risk reduction mode.”
One potential signal for market turbulence is the performance in the bond market. Data shows that the 30-year bond yield rose to 4.840%, its highest point since Sept. 5, even as the Federal Reserve delivered three rate cuts.
Meanwhile, the Swiss franc jumped to 1.260 against the US dollar. It has jumped by 16% this year, a sign that market participants are moving to safe havens as they anticipate potential turmoil in 2026.
Bitcoin price weekly chart points to a crash
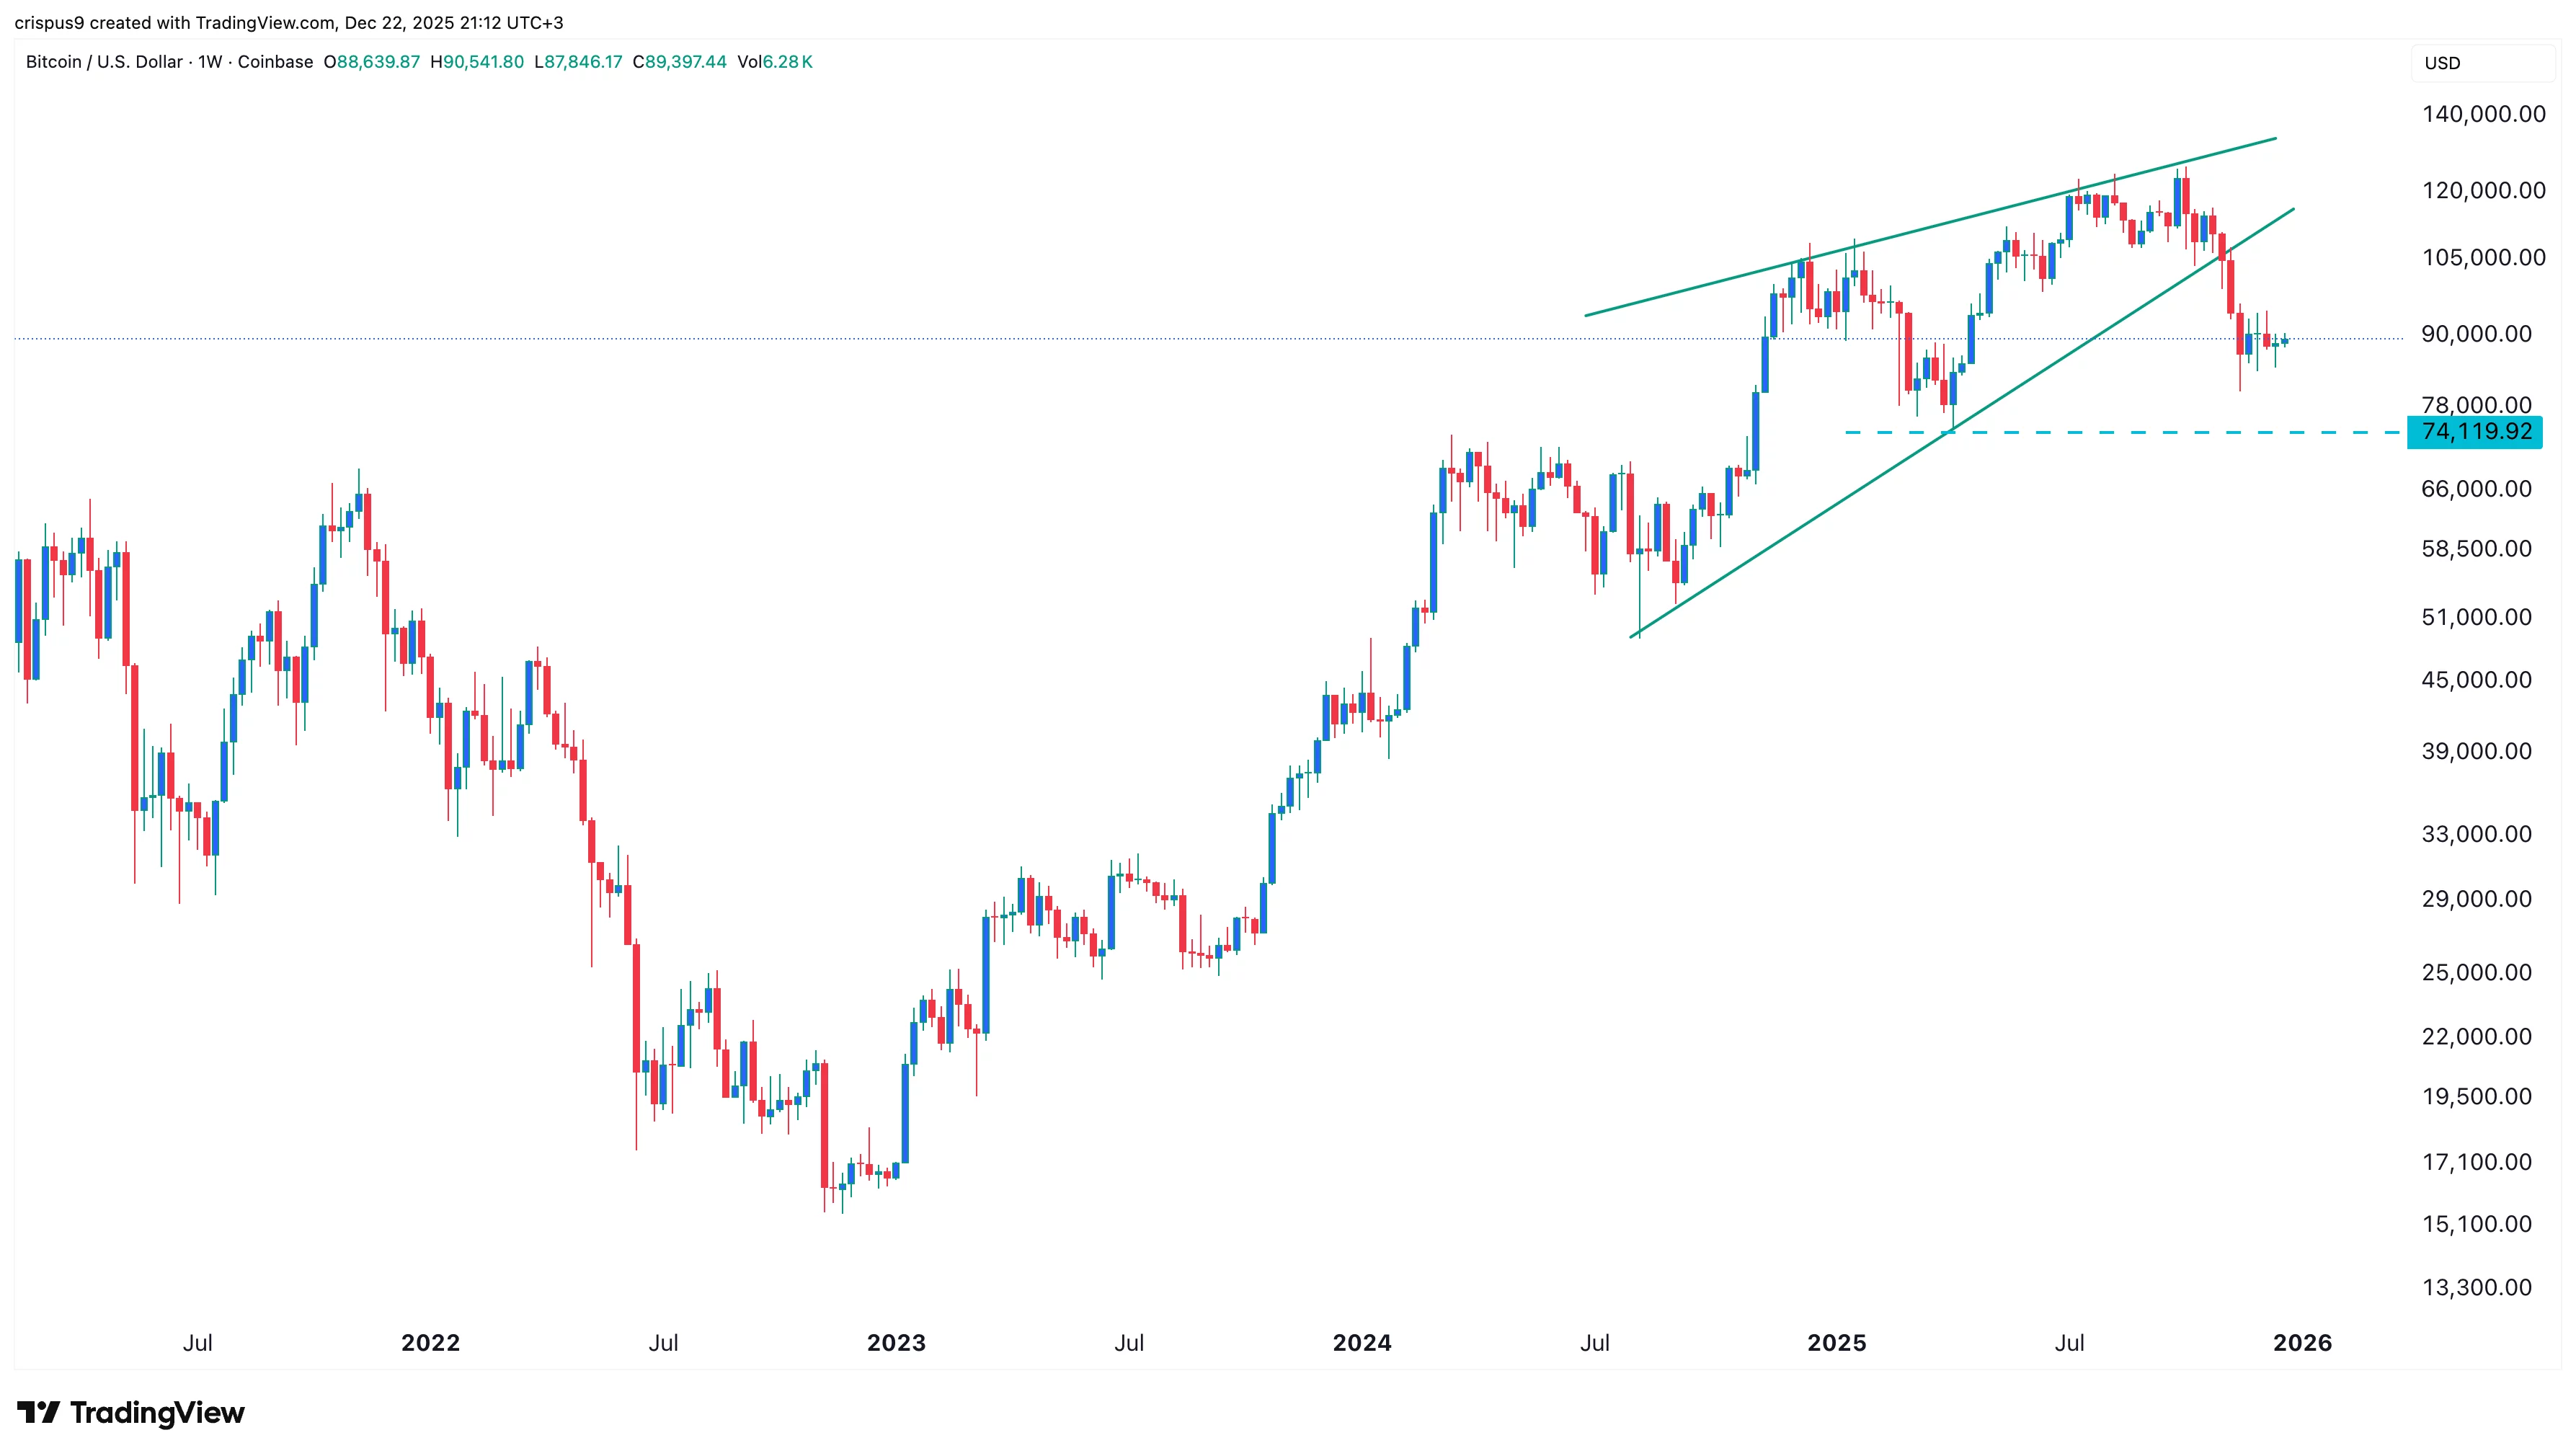
The weekly logarithmic chart indicates that Bitcoin’s (BTC) price slumped over the past few months. It has dropped from a high of $126,200 in October to the current $89,300.
The coin has formed a large rising wedge pattern. It has already moved below the lower boundary of this pattern, indicating further downside.
Bitcoin is also forming a bearish pennant pattern. Therefore, it will likely drop further, with the initial target being at the April low of $74,120.