Fartcoin, the fast-growing Solana meme coin, continued its strong rally this week, as whales accumulated.
Fartcoin (FARTCOIN) surged to a high of $1.2770 on Thursday, marking its highest level since January 26. It has become one of the best-performing meme coins this year, rallying over 500% from its March lows.
Data from Nansen shows that large whales have been accumulating the coin over the past few days. In the last 24 hours alone, whales acquired tokens worth several million dollars. As illustrated in the chart below, there were six individual purchases exceeding $1 million during this period.

Additional data shows that Fartcoin’s surge coincided with a sharp spike in futures open interest, which rose to a record $612 million on Thursday, up from less than $100 million in March. This indicates growing demand and participation in the derivatives market.
Further, Fartcoin’s eight-hour funding rate has remained positive since April 18. A positive funding rate is typically bullish, as it indicates that more traders are holding long positions, driving demand for longs higher than for shorts.

Fartcoin price technical analysis

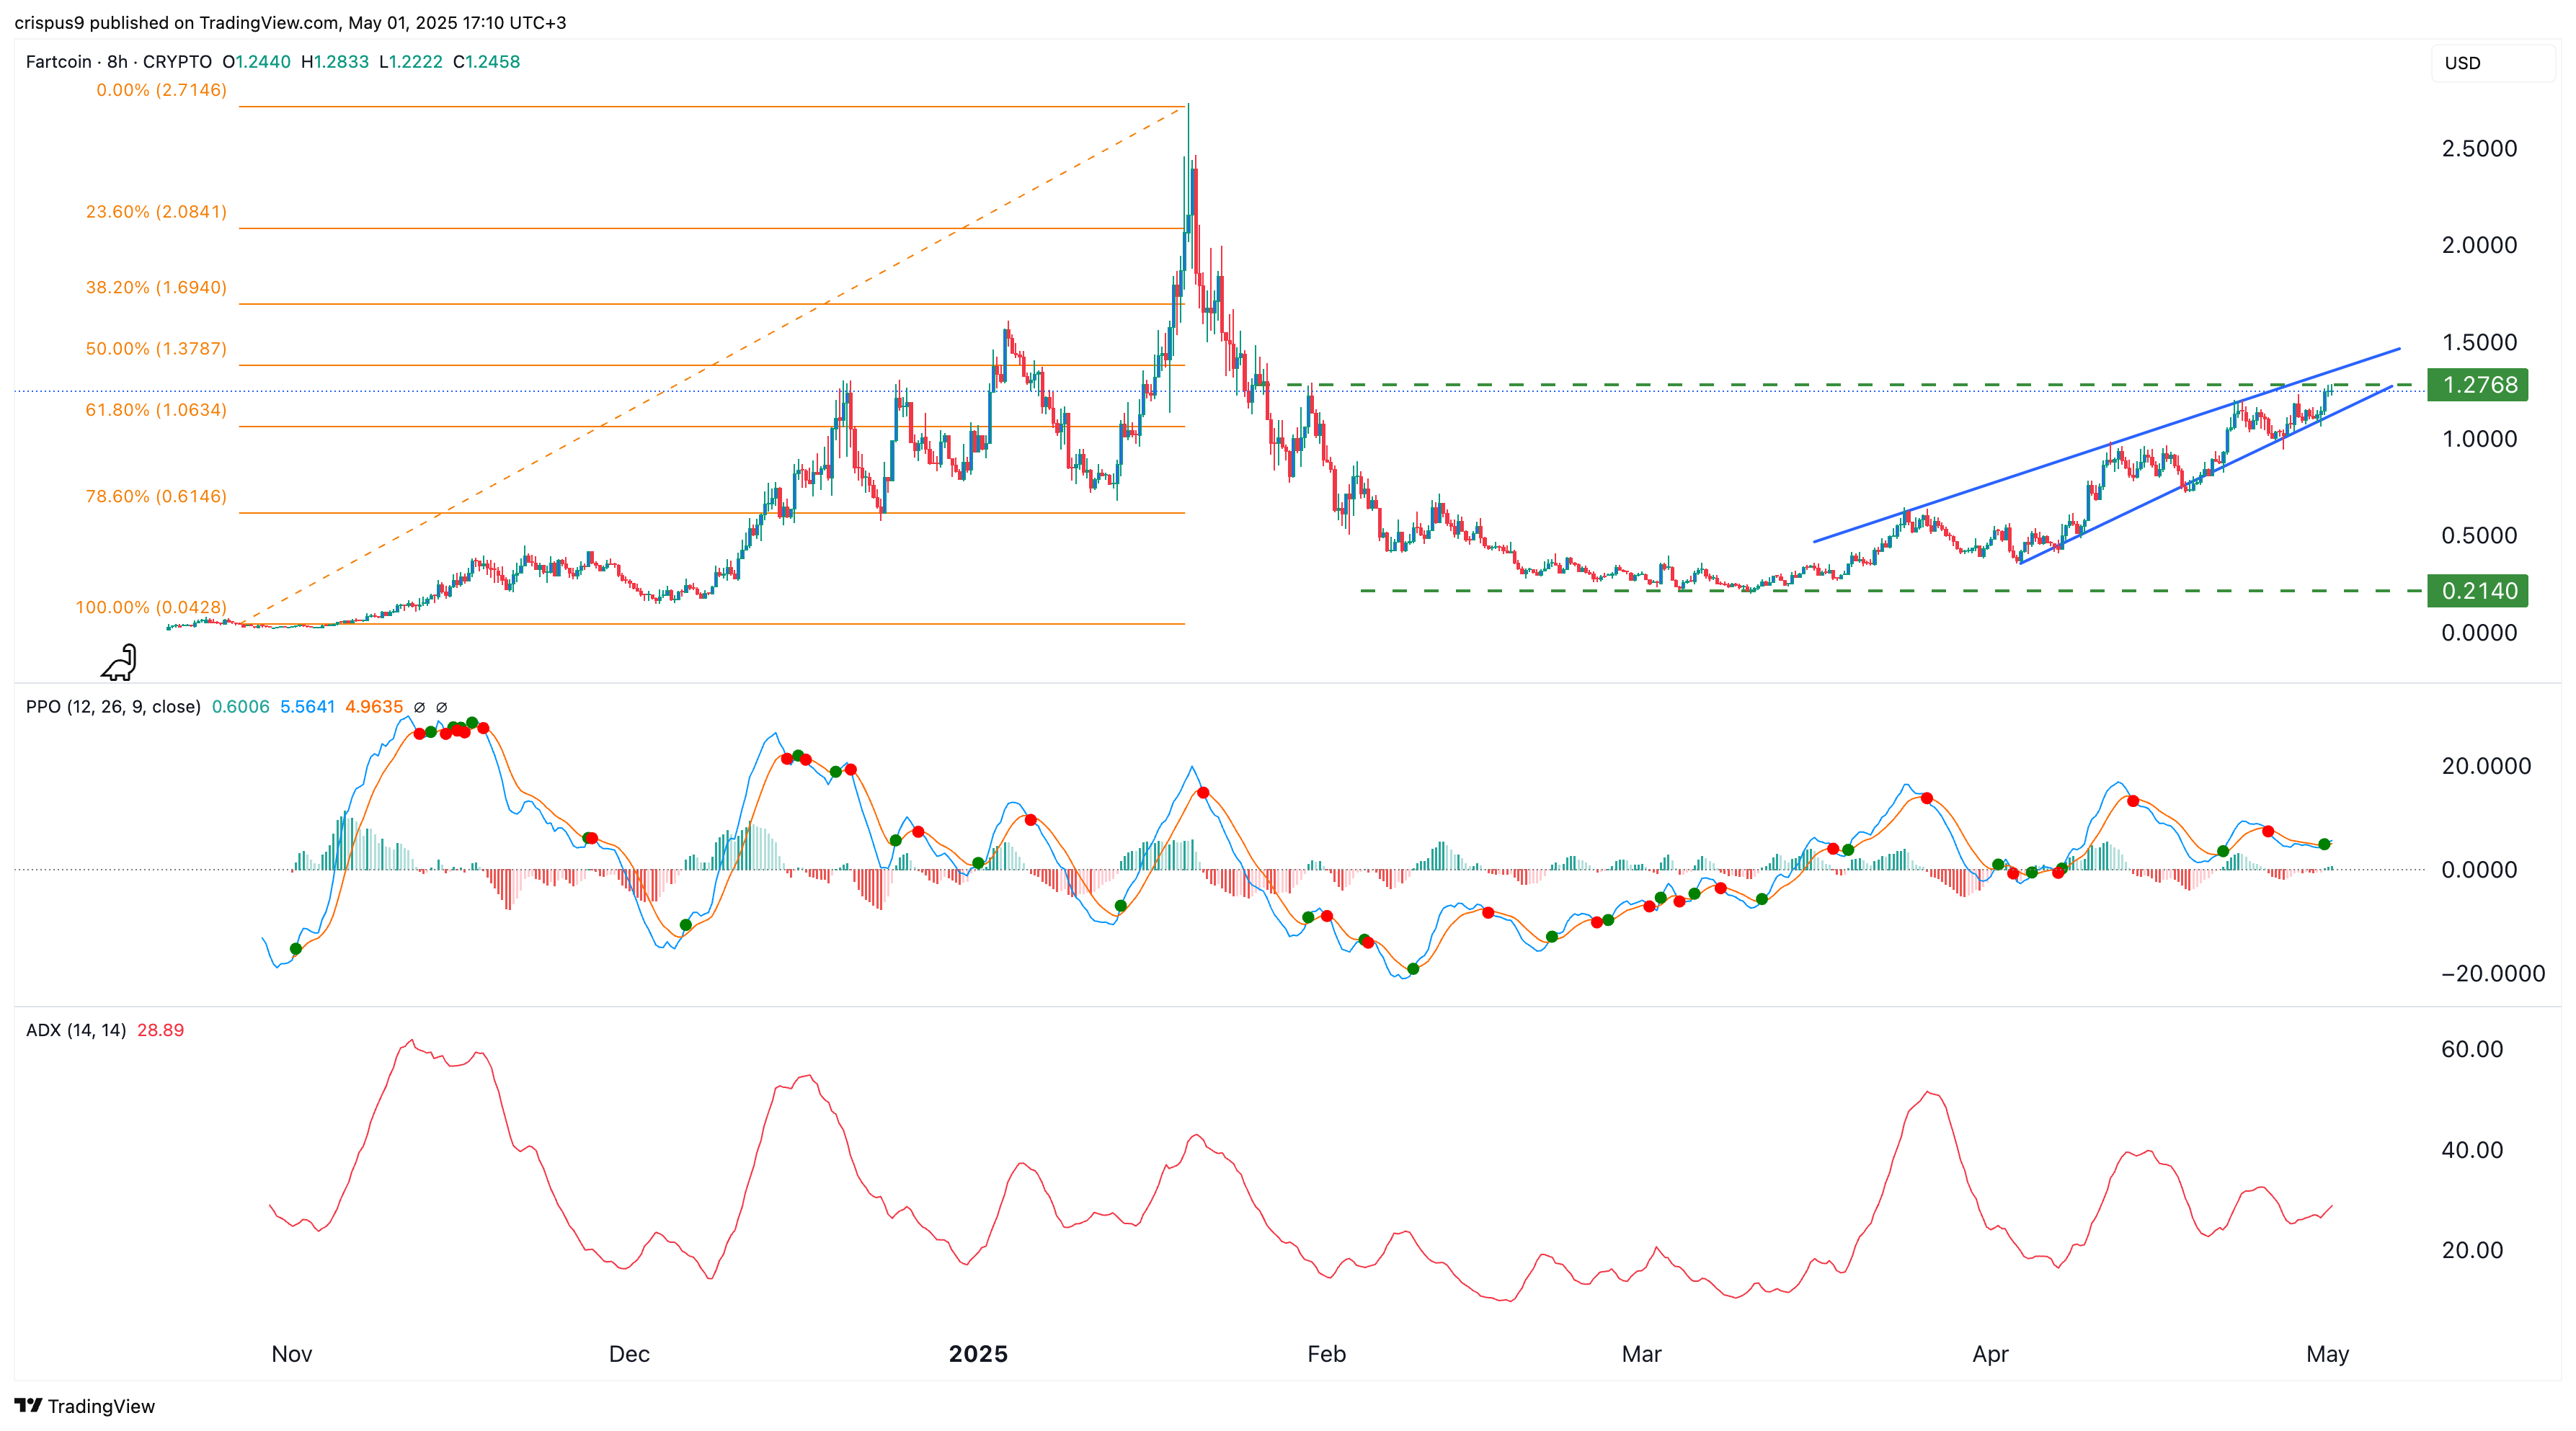
On the eight-hour chart, Fartcoin bottomed at $0.2140 in March and has since rallied to $1.2768 amid rising demand. The coin remains above the 50-period moving average, which supports a bullish outlook in the short term.
However, the chart is also signaling a potential reversal ahead. First, the coin appears to be forming a rising wedge pattern, illustrated in blue. This pattern is made up of two ascending, converging trendlines, and often precedes a breakdown once the lines converge.
Second, the Average Directional Index is moving sideways, a sign that the strength of this trend is waning. The ADX is one of the most popular indicators for measuring the strength of a trend.
Further, the Percentage Price Oscillator, a unique form of the MACD, has formed a bearish divergence pattern. Therefore, these technicals suggest that the coin may have a bearish reversal in May. If it happens, it will likely drop and retest the psychological point at $1.


