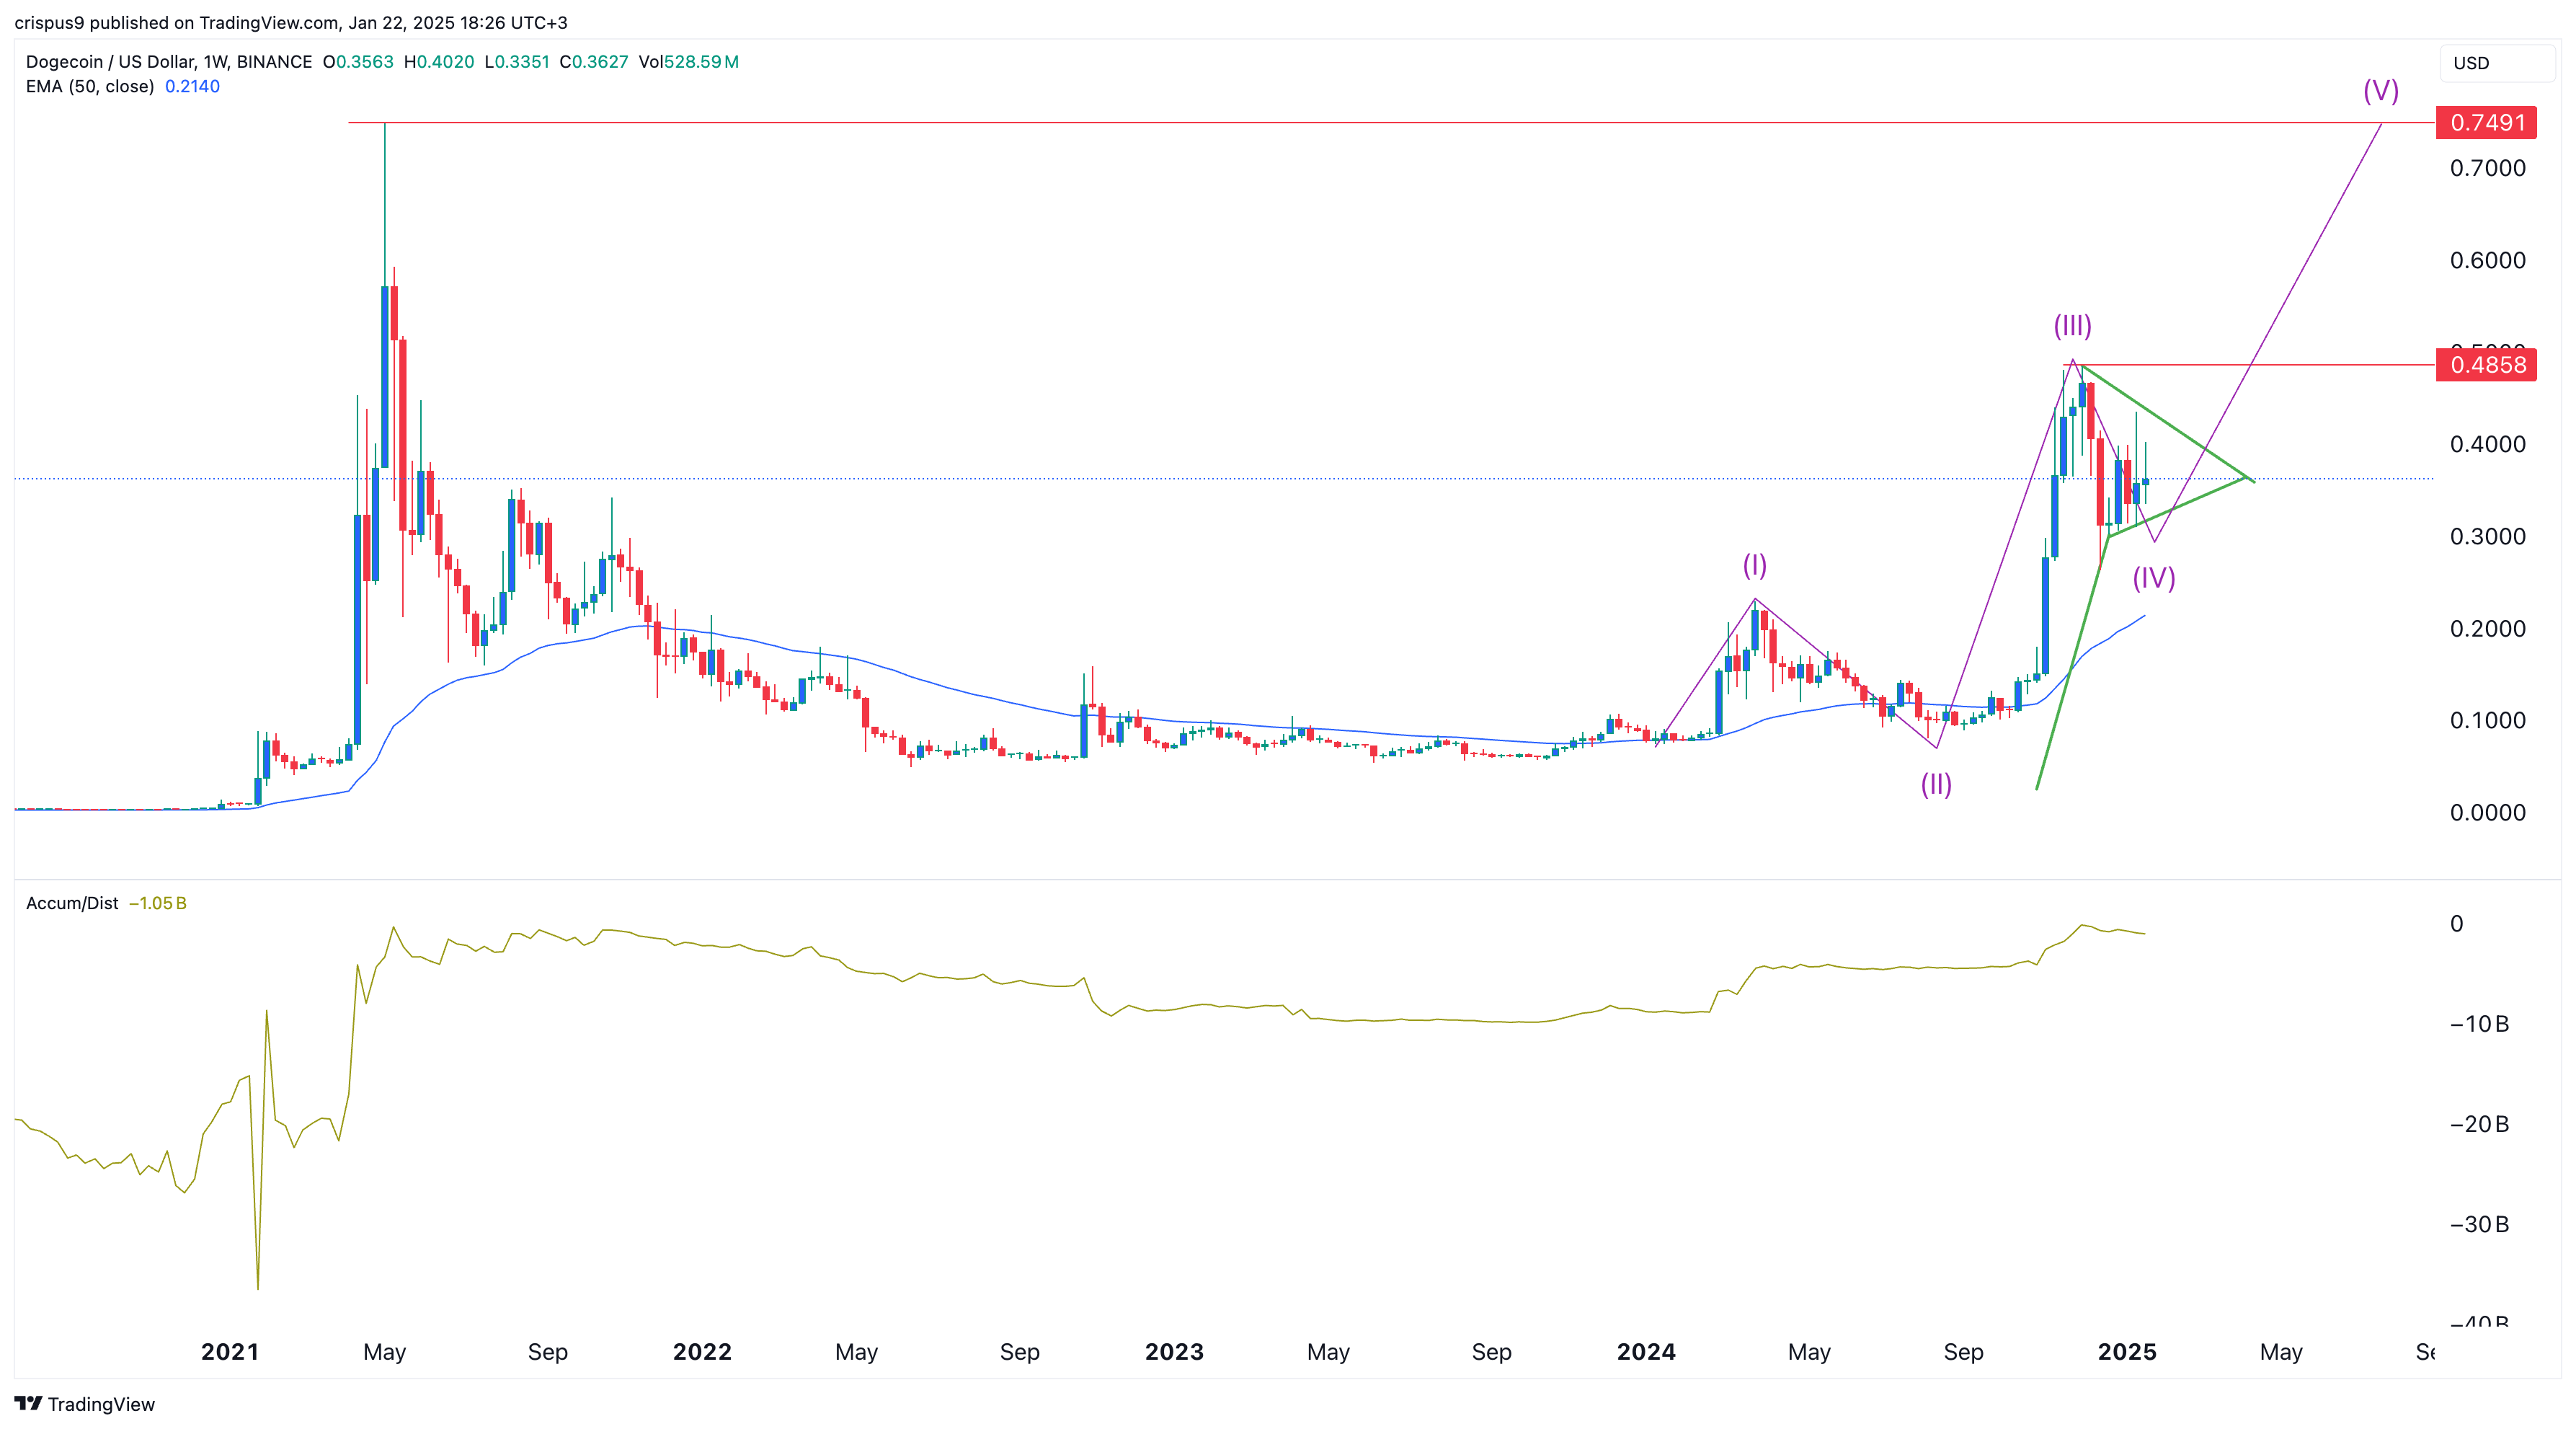
Dogecoin price has continued to consolidate this week as crypto traders rotate to newer meme coins like Official Trump and Fartcoin.
Dogecoin (DOGE), the largest meme coin in the industry, was trading at $0.36, approximately 25% below its highest point in 2024.
According to CoinGecko, DOGE recorded a 24-hour volume of over $3.7 billion, compared to Official Trump’s (TRUMP) $11 billion.
Still, Dogecoin has several catalysts on the horizon. First, whales appear to be accumulating the token. Data from Santiment shows that whales accumulated 590 million DOGE tokens in the last 24 hours. This adds to the millions of coins purchased this year, suggesting they anticipate a price rebound.
Second, the likelihood of a spot DOGE ETF approval by the Securities and Exchange Commission has risen. This week, Rex Osprey, a firm managing over $8 billion in assets, filed for a spot Dogecoin fund.
Third, Dogecoin price will likely benefit from the potential crypto bull run since technicals point to further Bitcoin price gains. Besides, Bitcoin ETFs are seeing strong inflows as supply on exchanges fall. Bitcoin gains will likely trigger more gains among altcoins, including DOGE.
Dogecoin price has formed a bullish pattern

The weekly chart indicates that DOGE has been in a consolidation phase over the past few weeks. It has now entered the fourth phase of the Elliott Wave pattern, which typically precedes the bullish fifth wave.
Dogecoin has also formed a bullish pennant chart pattern, characterized by a vertical line followed by a symmetrical triangle. The pattern is now approaching its confluence level, and a bullish breakout often follows a pennant pattern.
Additionally, the accumulation and distribution indicator has been rising, signaling that investors are actively buying. As a result, DOGE’s price is likely to rise, with bulls targeting the all-time high of $0.7491. A move to this level would represent a 110% increase from the current price.
The caveat is that signals provided by a weekly chart take time to play out. For instance, the pennant section has been forming for nearly three months.


