Solana price has rallied for three consecutive weeks as cryptocurrencies and meme coins in its ecosystem rebound.
Solana (SOL) crossed the key resistance level at $150, surging by 60% from its lowest point this month.
Most Solana meme coins have bounced back this week. Bonk (BONK) price soared by 35% in the last seven days, while Fartcoin (FARTCOIN), Dogwifhat (WIF), Pudgy Penguins, and Popcat (POPCAT) have climbed by over 50% in the last seven days.
This recovery has pushed the combined market cap of Solana meme coins to over $8.78 billion, a notable rebound from the $6 billion valuation seen earlier this month.
Decentralized exchanges within the Solana ecosystem have also experienced a sharp rise in trading activity. Monthly volume rose to $57.7 billion, passing Ethereum’s (ETH) $56.7 billion. Daily trading volume rose to $2.7 billion, higher than Ethereum’s $2.18 billion.
This rally has been fueled by platforms like Raydium, Pump, and Drift, whose weekly volumes have jumped by over 10%. Their trading activity tends to increase when meme coins and ecosystem tokens are performing well.
Additionally, Solana’s surge coincided with a rise in futures open interest, which reached $5.76 billion—its highest level since February 3. Rising open interest often signals growing investor interest and bullish momentum.
Solana has also solidified its position as the most active blockchain in terms of user engagement. The number of active addresses over the past seven days reached 28.7 million, while the total number of transactions hit 370.9 million.

Chart pattern points to a Solana price surge to $500

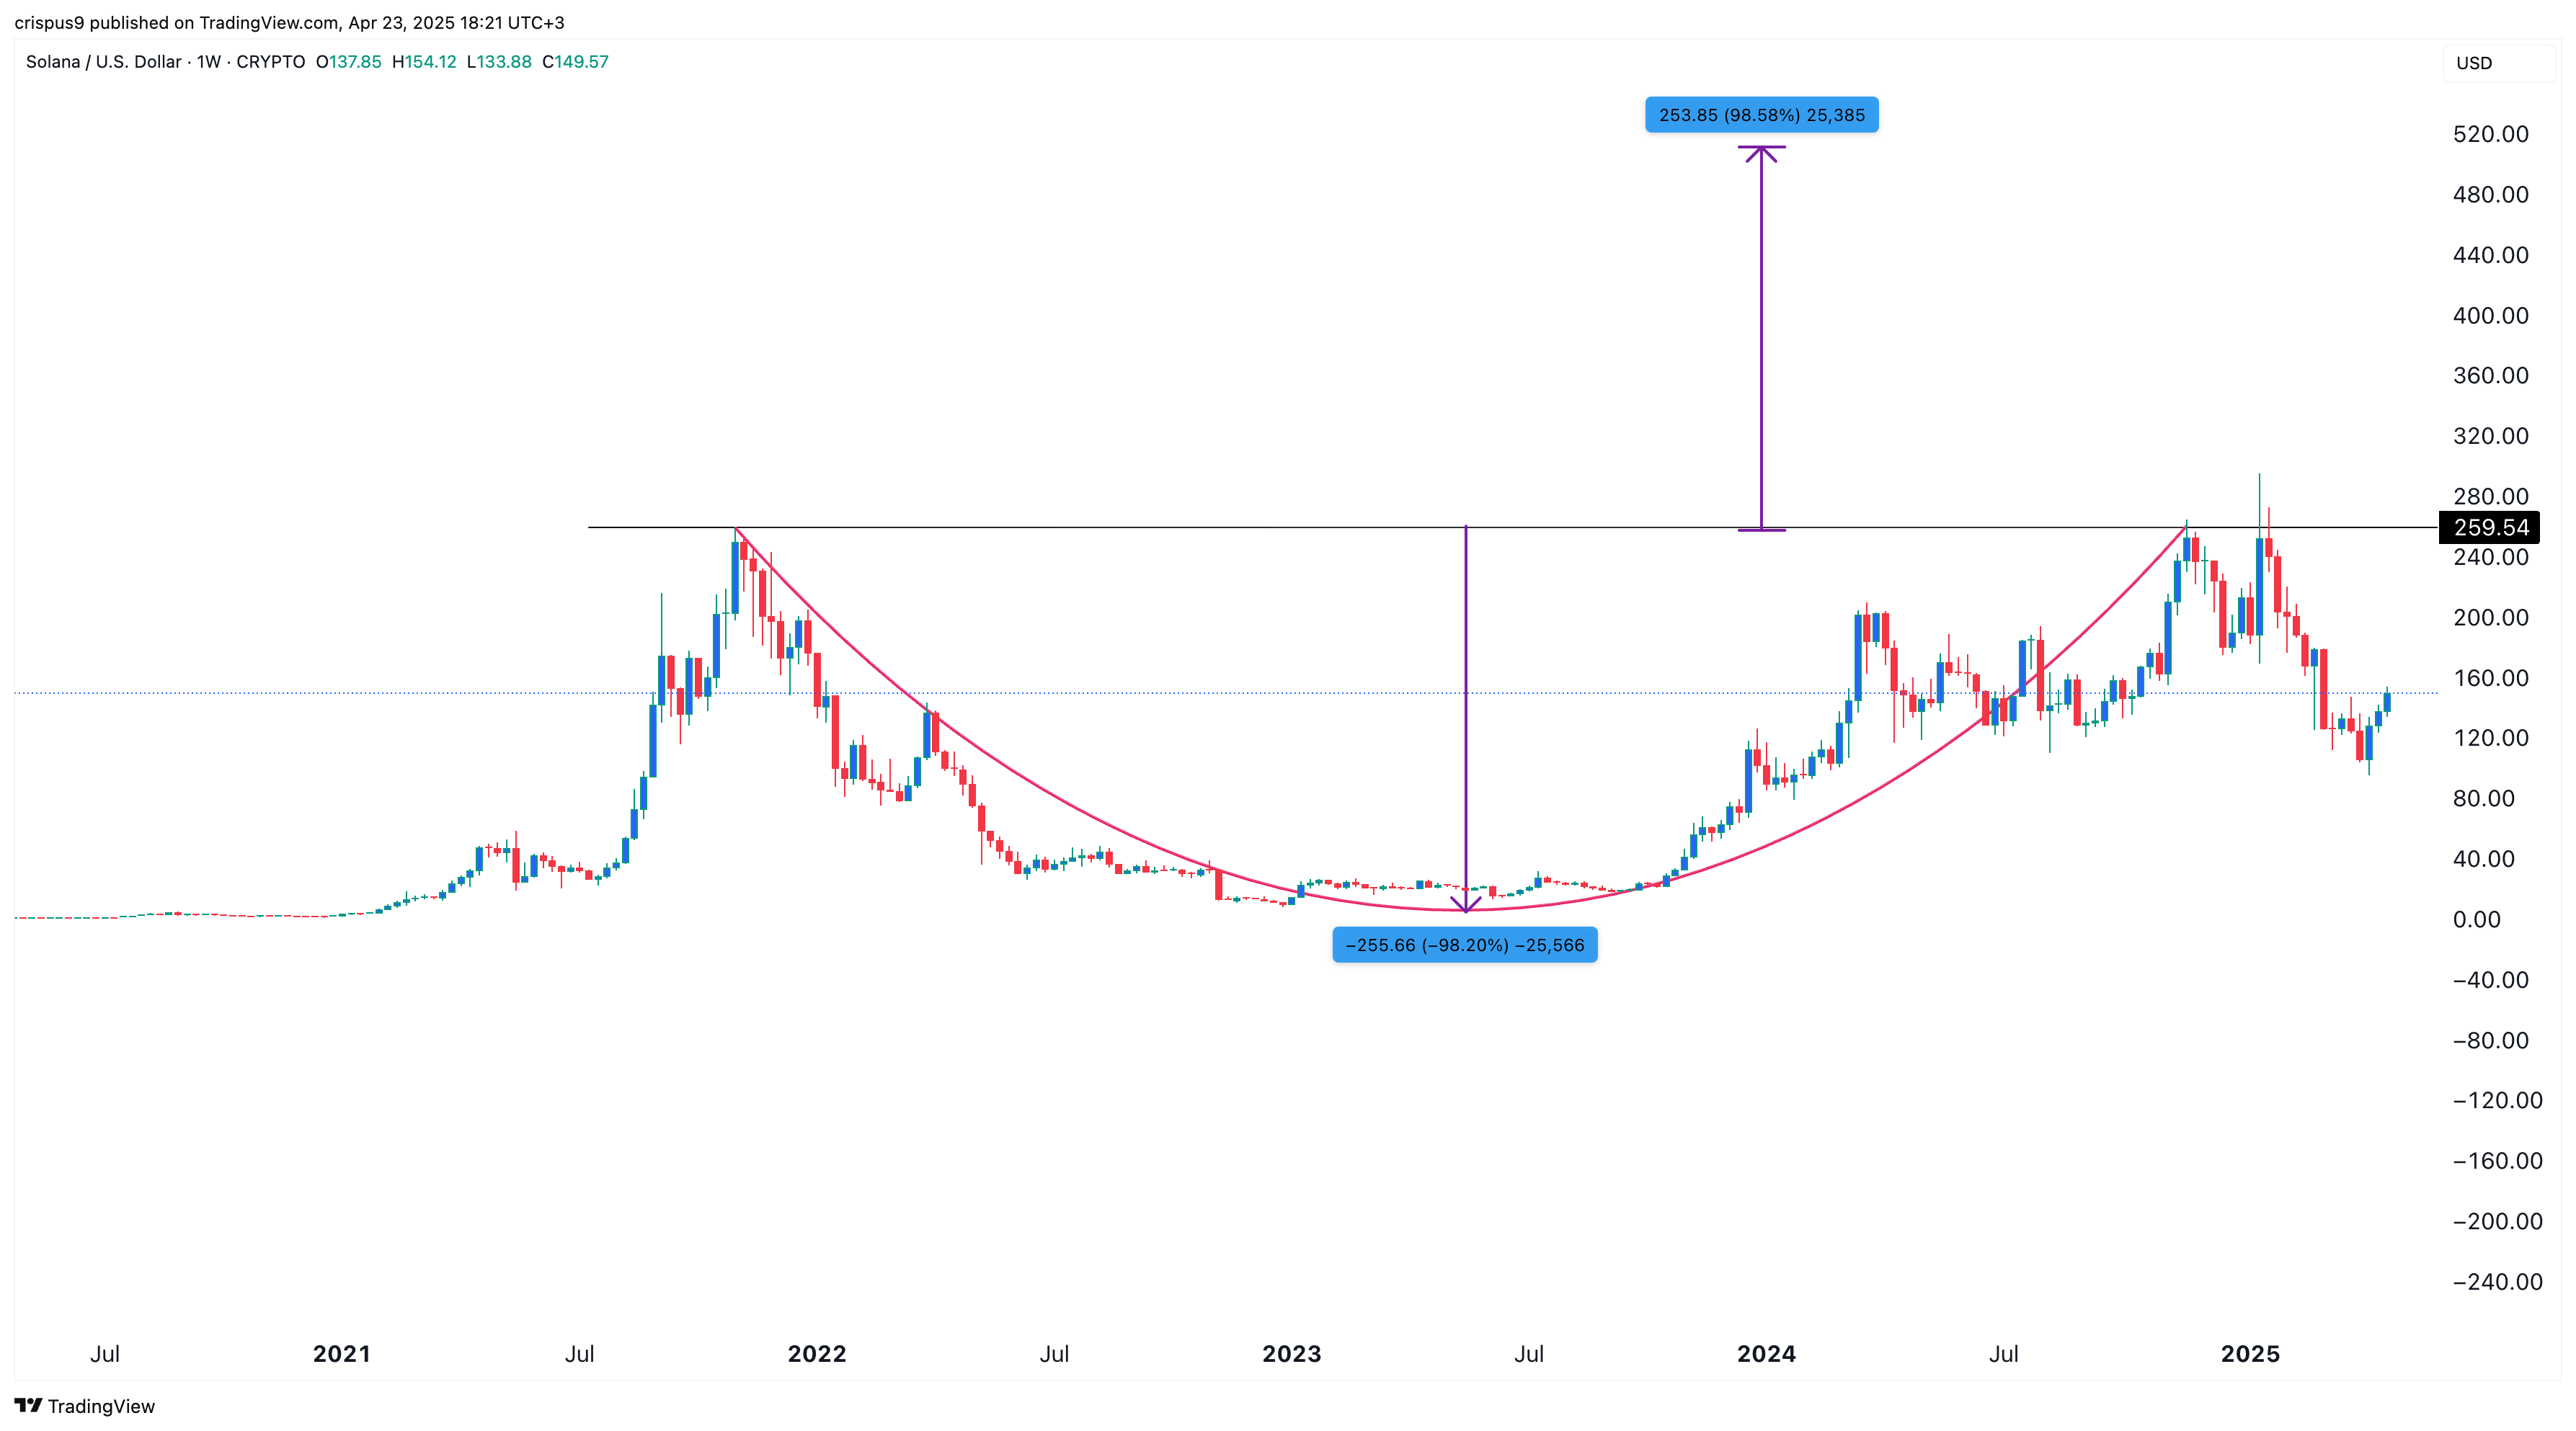
The weekly chart shows that Solana has formed a highly bullish technical pattern that could push the price toward $500 over time.
It has slowly formed a cup and handle pattern, comprising of a rounded bottom and a consolidation or a pullback. The recent retreat was part of forming the handle section of the pattern.
To estimate a target from a C&H formation, analysts typically measure the depth of the cup and project that distance upward from the neckline. In Solana’s case, the cup’s depth is about 98%, suggesting a potential upside from the $260 breakout level to around $515.
However, it’s worth noting that a cup and handle pattern on the weekly timeframe often takes time to play out. The cup section itself took about three years to form, meaning the path to $500 could unfold over several months or even years.


