


BNB price has recovered from last week’s selloff, but a dense liquidation wall near $628 and persistent resistance across higher timeframes have kept traders divided over whether the rebound can extend further.
Summary
- BNB price has rebounded about 9% from its June low, aided by short liquidations and support near $556.
- CoinGlass data shows major liquidation clusters between $620 and $628, making the zone a key resistance area.
- A break above $628 could target $650 and $673, while losing $556 may expose the long-term $500 support zone.
According to data from crypto.news, BNB (BNB) price was trading near $607 on June 12 after rebounding roughly 9% from its June 6 low around $556. The recovery followed a sharp decline from the late-May peak near $745, which wiped out more than 20% of the token’s value and pushed leveraged traders out of the market.
CoinGlass liquidation data shows part of the rebound was driven by a short squeeze after bearish positioning became crowded near local lows. The one-week liquidation heatmap highlights a large concentration of short liquidation liquidity between $615 and $620, with another notable cluster near $628.
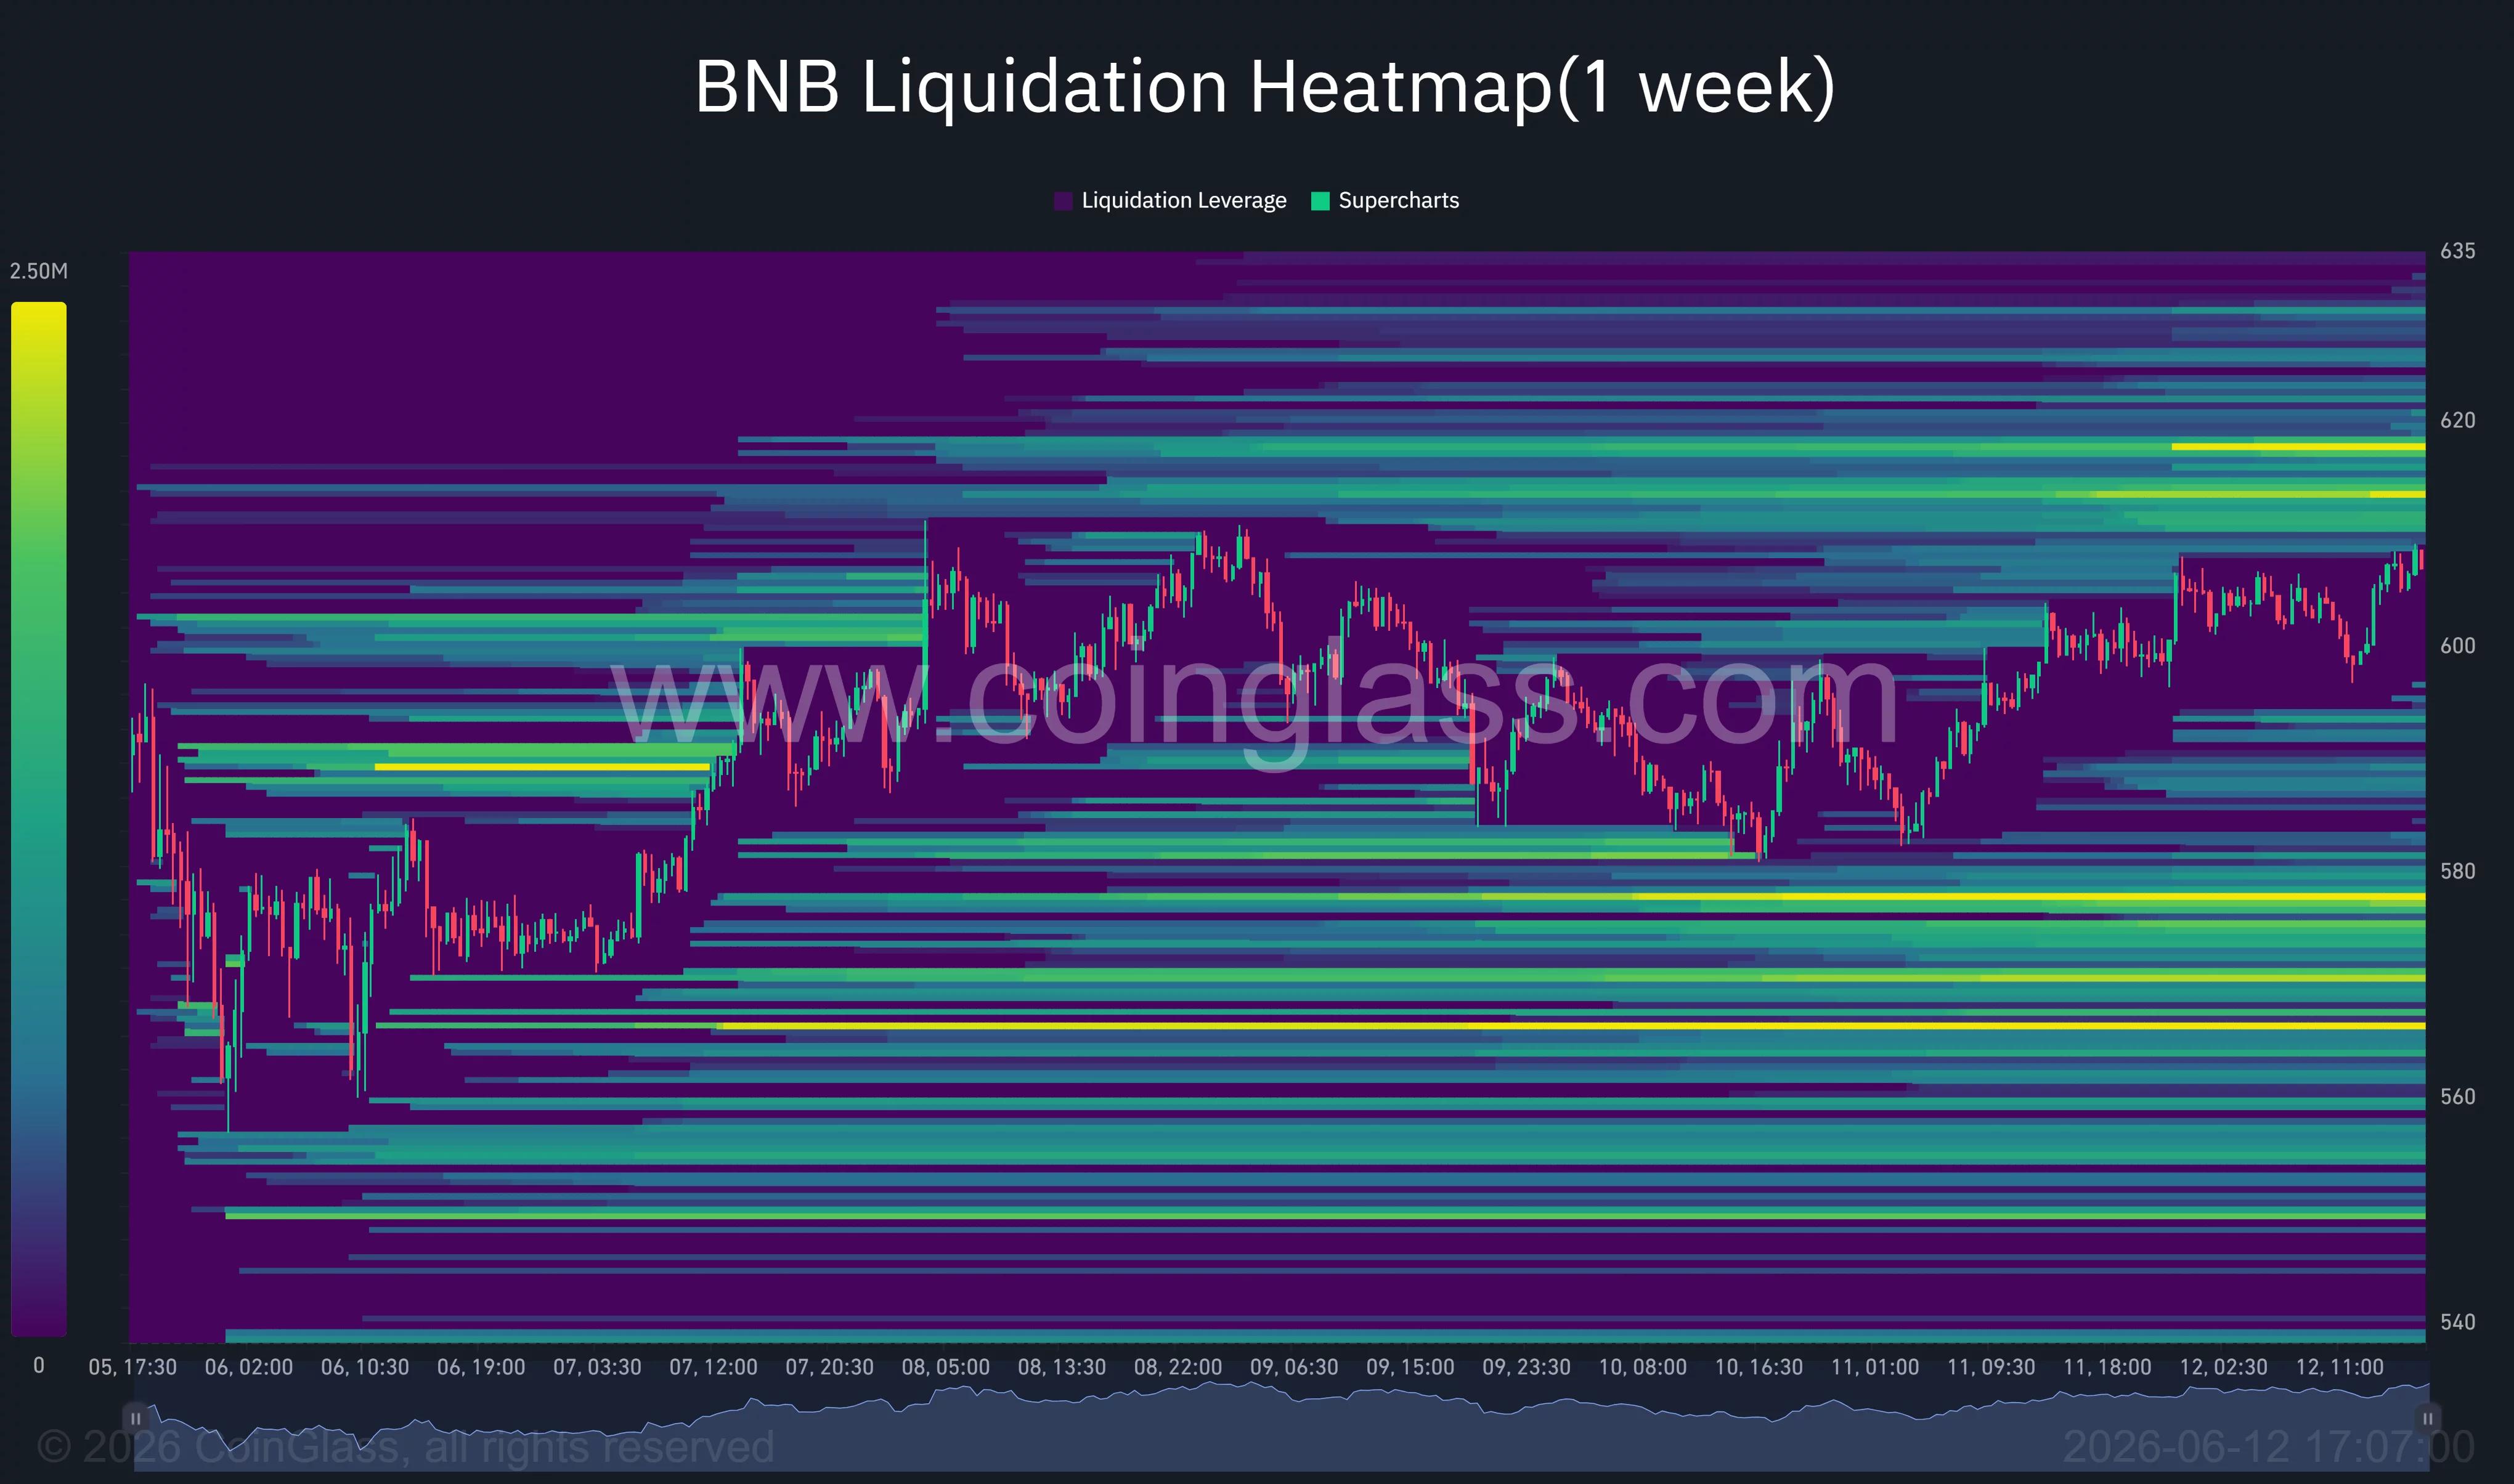
As BNB rebounded from the $560 area, traders betting on further downside were forced to close positions, helping lift the token back above $600.
At the same time, sentiment across the BNB ecosystem remains mixed. While Binance continues expanding activity across BNB Chain and its AI-focused initiatives, speculative interest has yet to return to levels seen during the rally toward $745.
At press time, BNB price remains well below its recent high and continues trading inside a range that has dominated price action since February.
BNB faces major resistance between $628 and $700
The four-hour chart shows BNB recovering inside a rising channel after finding support near the 100% Fibonacci retracement level around $556. BNB has reclaimed the 0.786 retracement near $596, while RSI has climbed above 56 and MACD remains marginally positive, suggesting buyers retain short-term momentum.
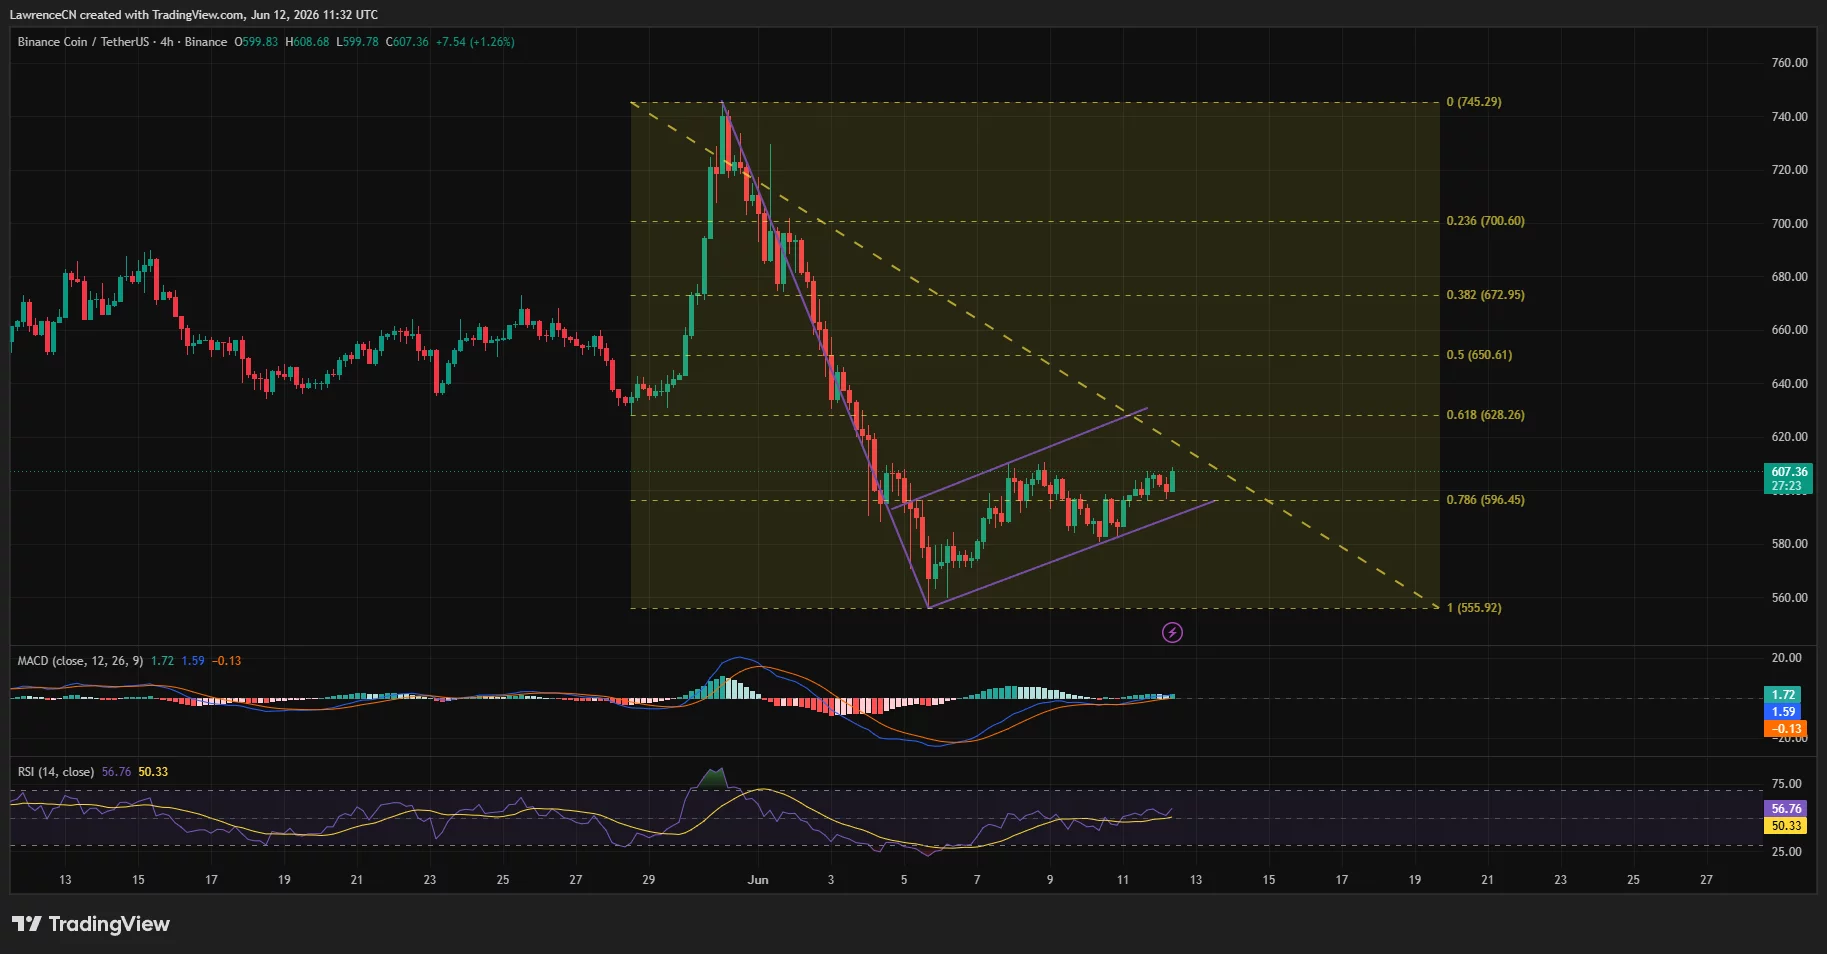
However, several technical barriers remain overhead. The first major resistance sits near $628, which aligns with the 0.618 Fibonacci retracement and the upper boundary of the current ascending channel. A successful breakout could expose the 50% retracement near $650, followed by the 38.2% level around $673.
Liquidation data reinforces those levels. CoinGlass heatmaps show substantial leveraged positions concentrated around $620 to $628, creating a potential liquidity magnet for price. If BNB reaches that zone, forced liquidations could accelerate volatility in either direction.
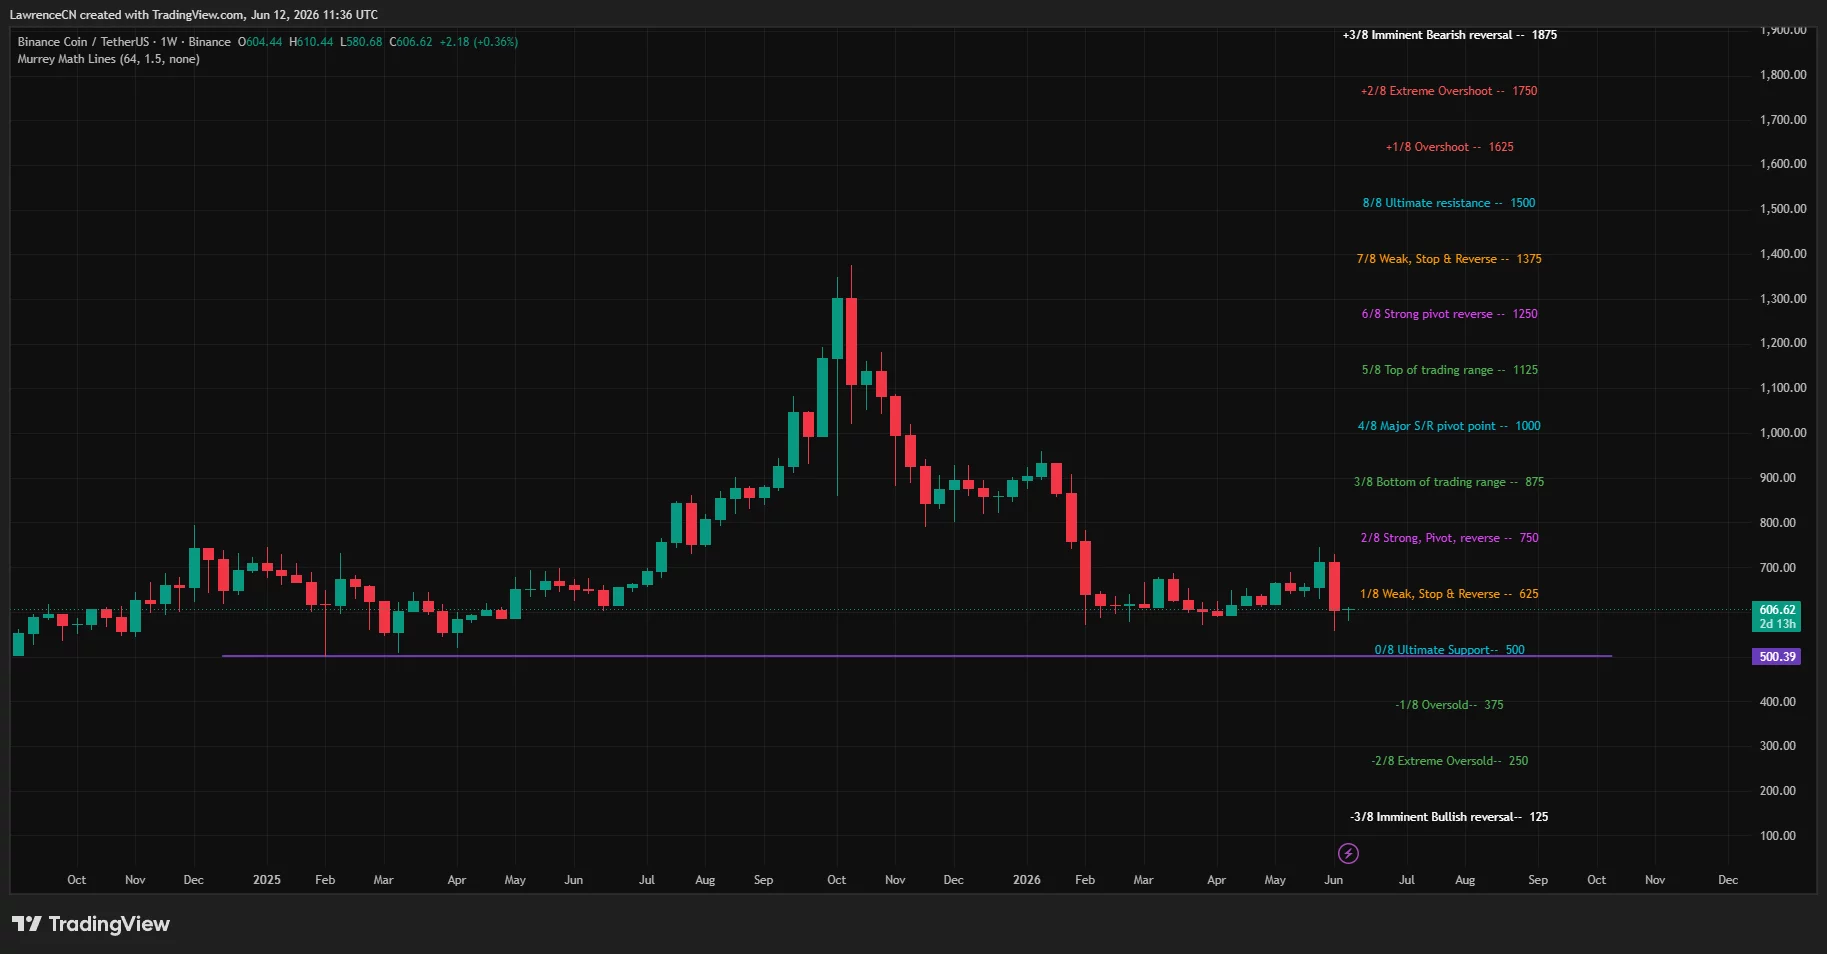
Higher-timeframe charts remain less constructive. The weekly Murrey Math structure places BNB below the key 1/8 reversal level at $625, while the next major support remains near the 0/8 line around $500.
Analyst Umair Orakzai argued that resistance continues to outweigh support after months of consolidation, writing that “the easier path now is the downside.”
A similar view was shared by fellow analyst James Bull, who highlighted the long-term $500-$600 region as a major accumulation zone.
”Historically, massive corrections in this range have set the stage for explosive upward continuation.”
Macro risks could send BNB back toward $500
Macroeconomic conditions remain one of the largest obstacles for risk assets. Stronger-than-expected U.S. economic data in recent weeks has reduced expectations for aggressive Federal Reserve easing, keeping Treasury yields elevated and limiting capital flows into speculative assets such as cryptocurrencies.
Oil prices and geopolitical developments also remain important variables after recent volatility tied to Middle East tensions. Any renewed surge in energy markets or deterioration in global risk sentiment could pressure crypto markets and reduce demand for altcoins.
From a technical perspective, the bullish setup remains valid as long as BNB holds above the $556 support zone that triggered the latest rebound.
Losing that level would invalidate the current ascending-channel structure and shift attention back toward the long-term accumulation area between $500 and $520.
For now, traders are watching the battle around $628. A breakout above that level could open the path toward $650 and $673, while another rejection would leave BNB trapped inside its multi-month range with downside risks still firmly in play.
Disclosure: This article does not represent investment advice. The content and materials featured on this page are for educational purposes only.